The UK is shifting towards a low cash society, with ATM withdrawals plummeting in some areas at an alarming rate.
Over the past two decades, the decline of cash has accelerated, with more banking customers opting for digital payments and contactless cards.
As a result, cash use has declined, now making up just 12 per cent of all payments—a sharp drop from 25 per cent in 2020 and 60 per cent in 2008.
Total ATM withdrawals have fallen in every single parliamentary constituency across the country, according to new figures from LINK.
In 2019, £116bn was withdrawn from cash machines nationwide. By 2024, this had plummeted to £80 billion – a 31 per cent decline.
The trend is particularly pronounced in affluent areas and city centres, while more deprived regions are moving away from cash more slowly.
 Equally as important as cash acceptance is cash access, writes Martin QuinnGETTY
Although UK banking customers are withdrawing less from ATMs every day, the data shows that when they do visit cash machines they take amount higher amounts of money.
The average constituency is now withdrawing £1million less every week compared to pre-pandemic levels.
John Howells, LINK's chief executive, said: "On average, withdrawals across the UK have fallen by 31 per cent. While we do not see the UK becoming a cashless society anytime soon, we are rapidly becoming a low-cash society.
"Crucially though, the picture is different across the UK and even across different parts of towns and cities. Covid changed how we live, how we work, and for many people, how we manage our cash.

The average constituency is now withdrawing £1million less every week compared to pre-pandemic levels
PA"The fact that areas which are more deprived are moving away from cash more slowly is a timely reminder that we cannot afford to leave anyone behind."
Howells emphasised the need to "focus more on digital inclusion as part of how technology is rolled out across the UK."
LINK runs a national Financial Inclusion Programme to ensure people can still access cash for free despite changing consumer behaviour.
The organisation reports that 93.6 per cent of people currently live within one mile of access to cash.
Cash usage has fallen dramatically from representing 60 per cent of all payments in 2008 to just 12 per cent today. However, even in areas with the fastest move away from cash, ATMs continue to serve an essential function.
The gap in cash usage is striking, with city centres and wealthier areas seeing the fastest decline in ATM withdrawals.
Bristol Central and Edinburgh North and Leith have both seen 67 per cent declines in ATM withdrawals since 2019. The Cities of London and Westminster follow closely with a 66 per cent drop.
In contrast, Weald of Kent experienced the smallest reduction at just 22 per cent. Other areas with slower declines include Leicester East (27 per cent), West Tyrone (28 per cent), and Knowsley (28 per cent).
Many of the areas moving away from cash more slowly have higher levels of deprivation and digital exclusion.
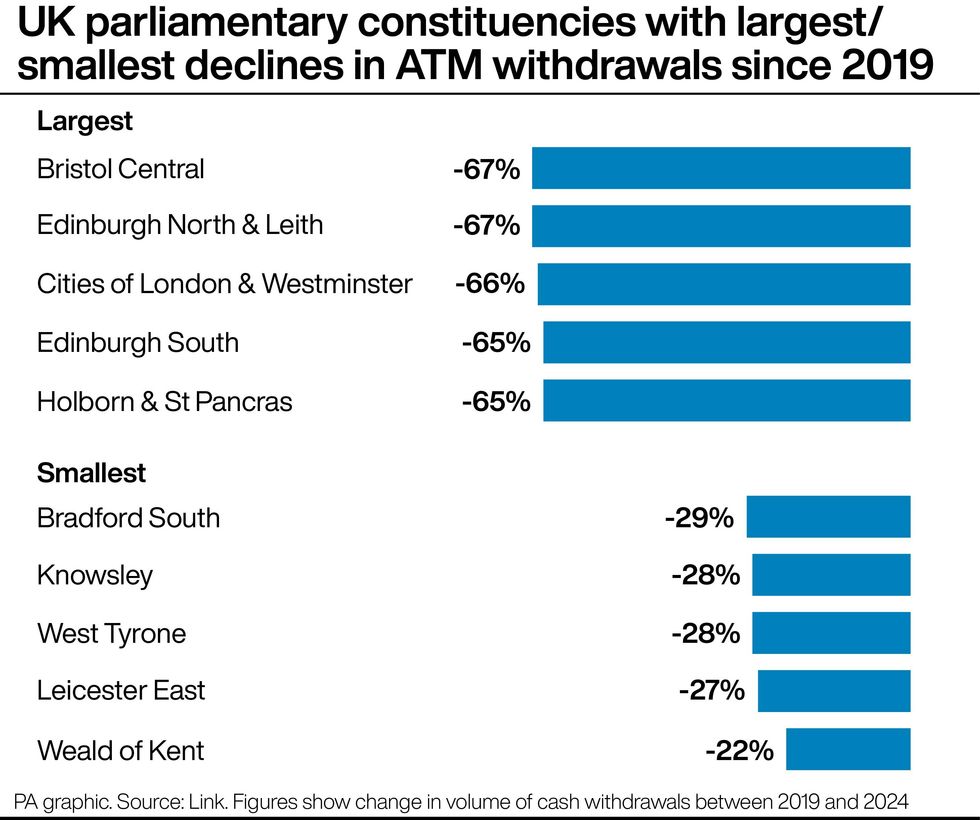
Decline in ATM usage
PA/LINK
20 Areas with the Fastest Declines in ATM Withdrawals (2019-2024)
Figures based on ATM usage within 2024 constituency boundaries, according to Link.
- Bristol Central – 67 per cent decline
- Edinburgh North and Leith – 67 per cent decline
- Cities of London and Westminster – 66 per cent decline
- Edinburgh South – 65 per cent decline
- Holborn and St Pancras – 65 per cent decline
- Edinburgh East and Musselburgh – 64 per cent decline
- Glasgow North – 64 per cent decline
- Sheffield Central – 64 per cent decline
- York Central – 64 per cent decline
- Leeds Central and Headingley – 63 per cent decline
- Oxford West and Abingdon – 62 per cent decline
- Islington South and Finsbury – 61 per cent decline
- Edinburgh West – 61 per cent decline
- Wimbledon – 61 per cent decline
- Brighton Pavilion – 61 per cent decline
- Winchester – 60 per cent decline
- Bath – 60 per cent decline
- Edinburgh South West – 60 per cent decline
- Cardiff South and Penarth – 60 per cent decline
- Nottingham East – 60 per cent decline